
ESC data logs from Castle Creations systems contain a large amount of performance data. The raw files are detailed but difficult to interpret without experience.
The RC Explained Data Log Analyzer, developed by RC Explained, simplifies this process. It converts log files into structured charts and calculated results. These outputs highlight key electrical and thermal behavior.
In the demonstration, the tool processes a Castle Creations Mamba XLX2 ESC log. The example focuses on a high-load speed run.
Overview of the Tool
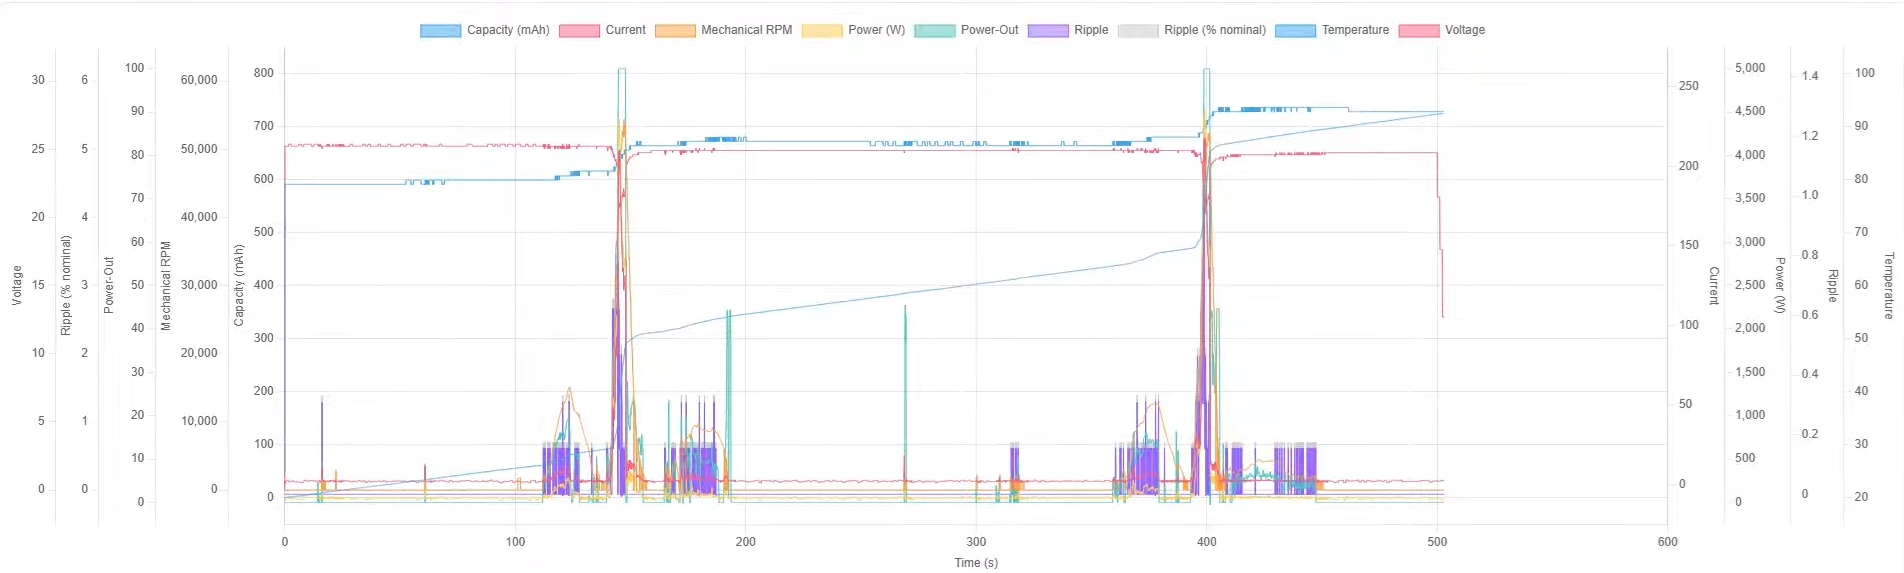
The Data Log Analyzer imports ESC log files and turns them into interactive graphs. These graphs show voltage, current, temperature, throttle, and capacity over time.
Users can zoom into specific sections of a run. They can also isolate short high-load events. The tool allows users to toggle data channels on and off.
It also supports unit changes. Users can switch between Celsius and Fahrenheit. Time can display in seconds or minutes.
This setup makes it easier to focus on key events. Full-throttle bursts and voltage dips become easy to identify.
Battery and Electrical Results
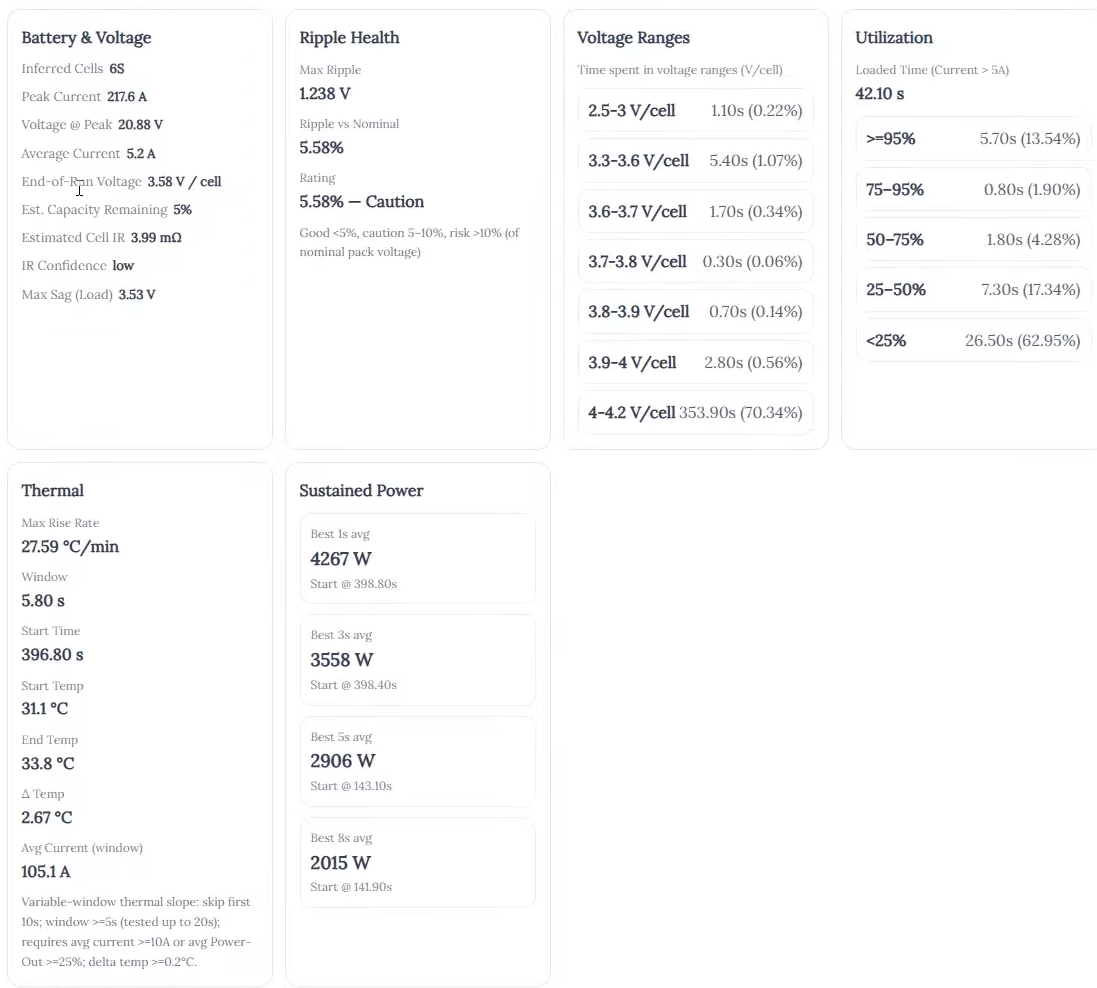
The example log shows a 6S battery setup. The analyzer calculates peak electrical load during the run.
Peak current reaches 217.6 amps. Voltage sits at 20.88 volts at peak load.
The tool estimates cell internal resistance at 3.99 milliohms. It also assigns a confidence rating based on available data points.
At the end of the run, capacity drops to about 5%. The tool flags this as a deep discharge condition.
Ripple and Voltage Behavior
The analyzer measures electrical stability through ripple and voltage sag. In the example, ripple measures 5.58%. The tool classifies this as a caution level.
The system tracks voltage over the full run. It shows how long the system stays in each voltage range. During peak load, the system shows strong voltage sag. Total drop reaches about 3.5 volts.
Throttle and Power
The tool rebuilds throttle usage across the run. It shows how long the system stays under load. In this case, the vehicle runs above 95% throttle for 5.7 seconds. The run reflects a short high-intensity burst.
The analyzer also calculates sustained power. It reports averages across multiple time windows. Peak electrical output reaches about 4,500 watts in this example.
Thermal Tracking
The tool tracks how quickly the system heats under load. It finds the fastest heating period in the run. It calculates temperature rise, time window, and current draw during that period.
In this log, the fastest heating rate reaches 27.59°C per minute. This occurs over a 5.8-second window. The run uses short speed passes. As a result, the thermal load stays brief.
Final Thoughts
The RC Explained Data Log Analyzer converts Castle ESC logs into structured performance data. It covers voltage, current, ripple, throttle, temperature, and power output. The tool reduces raw telemetry into readable results. It also provides visual charts for deeper analysis. Users can share logs through a single link. This removes the need for raw file transfer or external software.
Want to analyze your own setup beyond what’s covered in this post? Join RCexplained Insights Access for advanced data log analysis tools for Castle Creations ESCs, the monthly RC Calculator spreadsheet, searchable public data logs, and member resources built to help you tune, compare and improve performance. View membership plans here.