
In this run, I took the Arrma Limitless V2 back out to see if I could push past the previous top speed. After trimming down some aerodynamic pieces to minimize drag and extending my run distance, I set out to test how close the Arrma Limitless V2 speed test results would come to the RC calculator’s prediction. You can download a copy of the calculator that we will be using for this article from the Patreon site by becoming a member.
First Runs: Something Felt Off
Right from the first pass, the car felt unusual. The throttle response wasn’t smooth—it almost felt like the throttle was blipping instead of accelerating cleanly. I tried to stay steady, but the car started to wander and eventually spun out. Since it was a low-speed run (under 150 km/h), I brought it back, cooled the motor, and prepped for another pass.
Chasing More Speed
Even on the next attempt, something still felt off. Sometimes you get to your testing spot and realize the day just isn’t working for you—conditions, equipment, or even your rhythm feels off. Normally, that’s the time to pack up and head home. But I was determined to get a higher reading and kept going.
The Crash
On the third pass, everything looked promising until the car suddenly veered right and flipped. From the replay, it seemed like the brakes locked or the steering input caused a sharp pull. The vehicle veered off the road during the braking phase of the speed run. The crash invalidated the pass—but I still checked the data. The GPS showed a top speed of 216 km/h (134 mph) before the crash.
Comparing to the Calculator Prediction
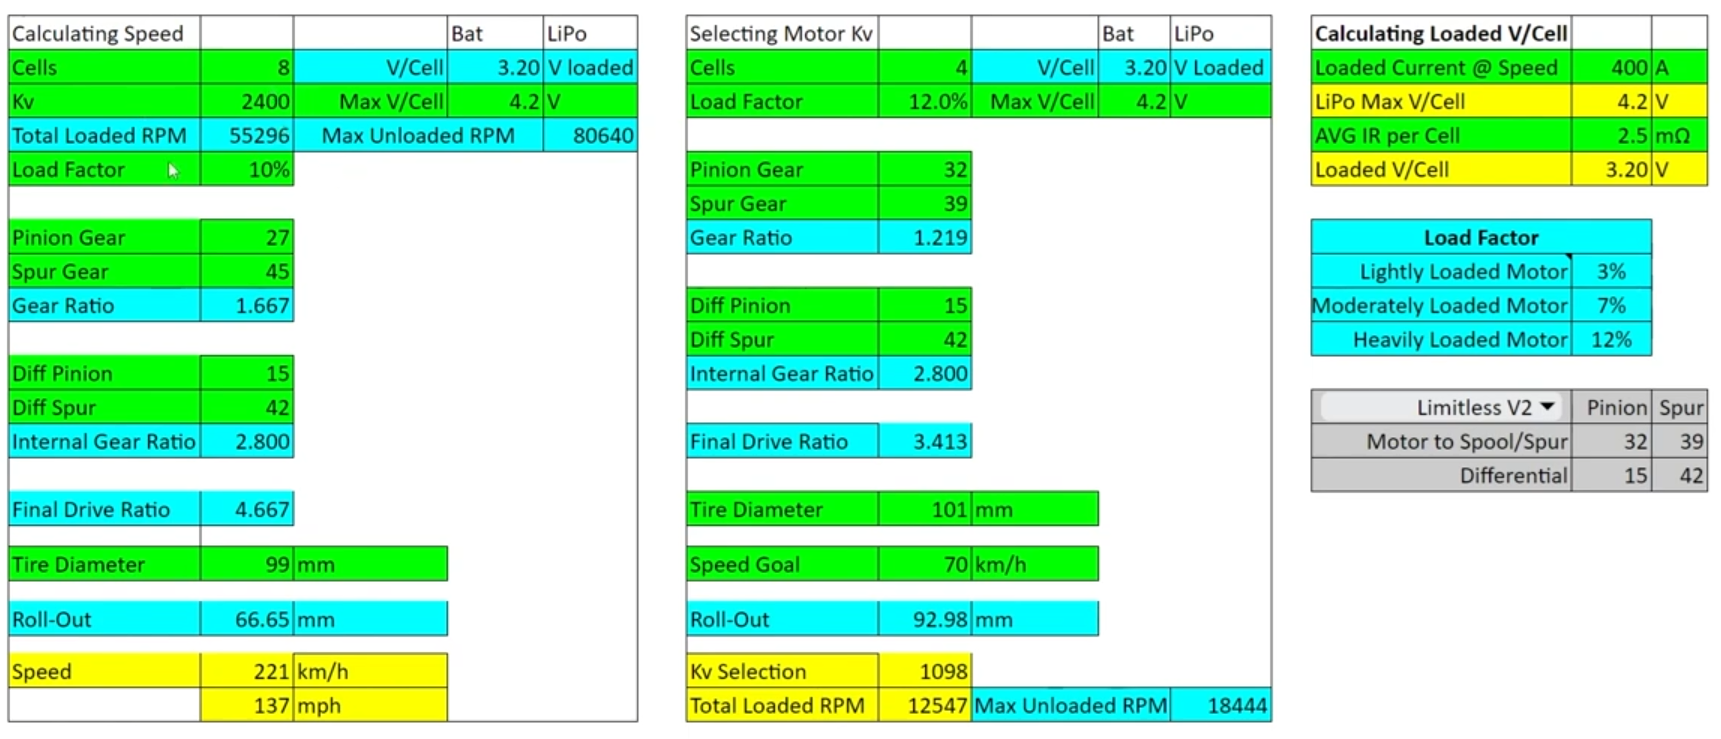
Here’s the setup used for the test:
- Battery: 8S
- Motor: 2400 Kv
- Load Factor: 10
- Loaded Current at speed: 400 A
- Internal Resistance: 2.5 mΩ per cell
- Gearing: 27 T pinion / 45 T spur / stock differential
- Tires: 99 mm diameter
The RC calculator predicted a top speed of 221 km/h (137 mph). Comparing that to the actual 216 km/h, the difference was –2.26 %, showing remarkable accuracy between the model and real-world results.
| Metric | Predicted | Actual | Difference |
|---|---|---|---|
| Top Speed (km/h) | 221 | 216 | –2.26 % |
| Top Speed (mph) | 137 | 134 | –2.26 % |
Key Takeaways
- The modified aero helped, but throttle consistency and control issues limited results.
- Even after the crash, the Arrma Limitless V2 speed test validated the RC calculator’s prediction within a 2.3 % margin—impressive accuracy for such extreme conditions.
- Conditions, driver input, and road surface all play a bigger role than minor setup changes once you’re above 200 km/h.
Final Thoughts
While the run didn’t go perfectly, it proved how close calculated top speeds can be to real-world performance when the inputs are accurate. Despite the crash, the 216 km/h pass shows the setup is capable of hitting the predicted numbers with better traction and throttle control. Stay tuned—the next session gets even more interesting.
Want to analyze your own setup beyond what’s covered in this post? Join RCexplained Insights Access for advanced data log analysis tools for Castle Creations ESCs, the monthly RC Calculator spreadsheet, searchable public data logs, and member resources built to help you tune, compare and improve performance. View membership plans here.